
free tool · Token discovery and scanners
liquidity to market cap ratio checker
Is the market cap real? See how much money actually backs it.
- 100% free
- No sign-up
- No wallet connection
- Live data: DexScreener
your numbers
your result
Liquidity is what you can actually sell into; market cap is just price × supply. The lower the ratio, the bigger the gap between paper value and what holders can cash out.
Runs in your browser. Nothing is stored or sent to us. Not financial advice.
quick answer
What is a good liquidity ratio for a memecoin?
Around 10% or more of the market cap in the main pool is healthy for a memecoin; under 5% is thin and under 2% is a red flag.
how to use the liquidity to market cap ratio
The liquidity to market cap ratio shows how much real money backs a token's valuation. Paste a contract address or type liquidity and market cap to get the ratio, a plain-English rating, and the sell size that would drop the price by 10%.
Load the pool
Paste a contract address to fill in the most liquid pool's numbers, or type them.
Read the rating
Read the ratio and its rating, from very thin to deep.
Check the exit size
Check the sell size that moves the price 10%: that is how much can leave before the chart breaks.
Add the volume
Add 24-hour volume to see how many times the pool turned over in a day.
formula
The exact math the liquidity to market cap ratio runs, so you can check any result by hand.
ratio = pool liquidity ÷ market capsell that drops the price 10% = (liquidity ÷ 2) × (1 ÷ √0.9 − 1) ≈ 0.054 × (liquidity ÷ 2) (constant-product pool)turnover = 24h volume ÷ liquidity
guide
what is a good liquidity to market cap ratio?
- Under 2%: very thin. A few thousand dollars of selling crashes the price.
- 2 to 5%: thin. Whales cannot exit without heavy slippage.
- 5 to 10%: moderate, common for trending memecoins.
- 10 to 30%: healthy for a memecoin.
- Over 30%: very deep, or a fresh launch whose pool is most of its value.
Large, established tokens can run lower ratios because their liquidity sits across many pools and centralized exchanges; the calculator only sees the pool you give it.
why it matters more than market cap
Market cap is the last price times supply. Liquidity is what you can actually sell into. A token at a $2M market cap with $40K of liquidity has a 2% ratio: if holders tried to cash out even 5% of the market cap, the price would collapse long before they finished. Tokens with pulled or never-added liquidity often show sky-high market caps with almost nothing in the pool.
frequently asked questions
How is the liquidity to market cap ratio calculated?
Divide the pool's total liquidity (both sides, in USD) by the token's market cap. $60K of liquidity on a $600K market cap is 10%.
What does high volume compared to liquidity mean?
A pool that trades 20 or more times its liquidity in a day is churning hard: bot activity, a pump in progress or wash trading.
related free tools
The next check traders usually run after this one.
Token discovery and scanners
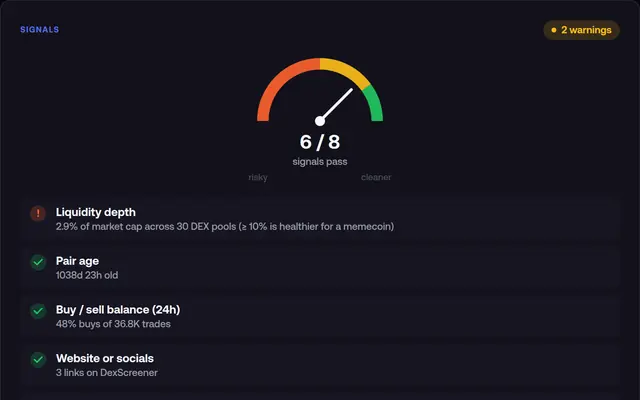
Memecoin token scanner
Paste a contract address and spot rug signals in seconds.
Try it free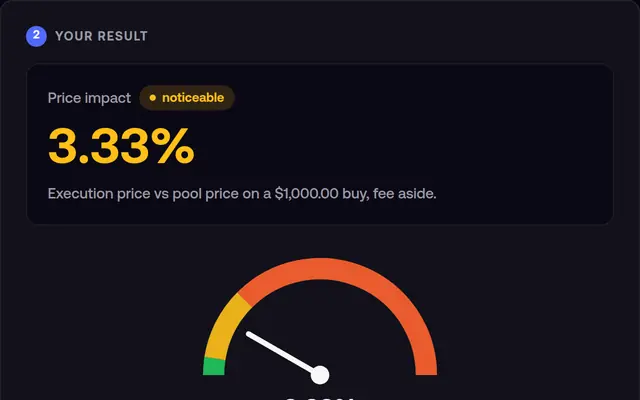
DeFi and perps calculators
Price impact and slippage calculator
See how much your buy or sell moves the price before you swap.
Try it free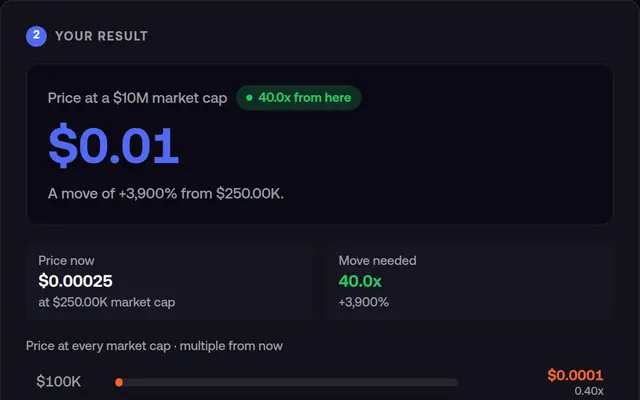
Memecoin trade calculators
Memecoin market cap calculator
See your token's price at any market cap and what your bag is worth.
Try it freecatch the next runner the second it trends
A Telegram call the moment a token enters FOMO's Trending list, then 2x, 5x and 10x updates. The live top 15 refreshes every 5 seconds.
Trade these tokens on FOMO (fomo.family), the social trading app where they trend. Referral link.
Updated by Fomo Trending. Free, no sign-up, runs in your browser. Not financial advice.